CONTENT
Our dataset contains sequences with two and three motions. The sequences can be roughly divided into three categories:
- Checkerboard sequences: this category consists of 104 sequences of indoor scenes taken with a handheld camera under controlled conditions. The checkerboard pattern on the objects is used to assure a large number of tracked points.
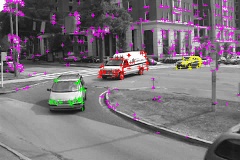
- Traffic sequences: this category consists of 38 sequences of outdoor traffic scenes taken by a moving handheld camera.
- Other (Articulated/non-rigid sequences): this category contains 13 sequences displaying motions constrained by joints, head and face motions, people walking, etc.
| 2 Motions | 3 Motions | |||||
|---|---|---|---|---|---|---|
| # Seq. | Points | Frames | # Seq. | Points | Frames | |
| Checkerboard | 78 | 291 | 28 | 26 | 437 | 28 |
| Traffic | 31 | 241 | 30 | 7 | 332 | 31 |
| Others | 11 | 155 | 40 | 2 | 122 | 31 |
| All | 120 | 266 | 30 | 35 | 398 | 29 |
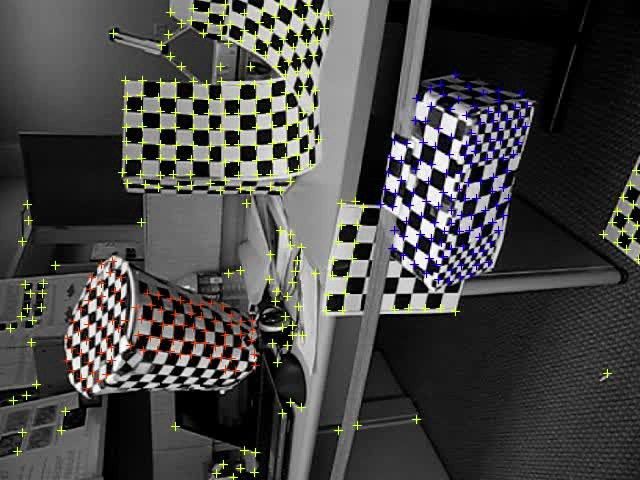 |
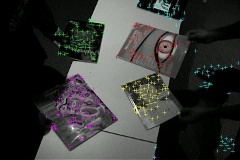
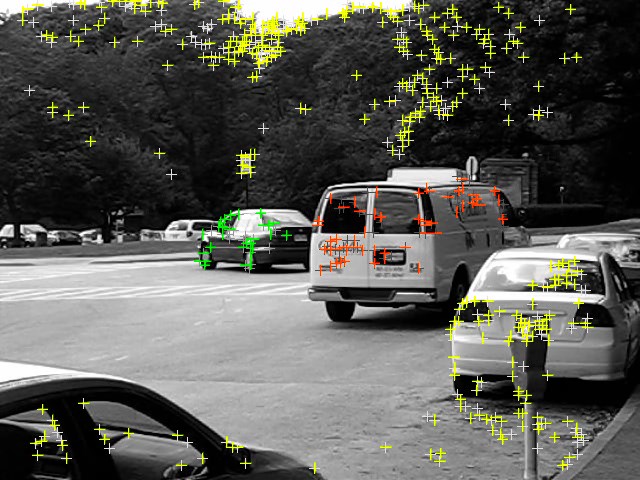 |
| Some samples from the Hopkins 155 dataset | |